Aspartame is safe

“I can’t believe you drink that stuff.”

I drink diet pop. Though on its face that doesn’t seem controversial, I find myself regularly defending my beverage choice when I crack open a can of Diet Coke. People say it’s bad for me, or it’s “unhealthy”. Why do they think that? My guess is that many people believe that since diet pop contains “artificial” ingredients, it’s not “natural”1, and therefore it’s not “healthy” to drink. When I ask which ingredients in diet pop are “unhealthy”, many people target aspartame. Though I’m not motivated to argue why aspartame might be healthy (or not unhealthy), I’ve thought about the chemical’s safety enough to want write about it here2.

Aspartame is safe

The Food and Drug Administration (FDA) claims, “Aspartame is one of the most exhaustively studied substances in the human food supply, with more than 100 studies supporting its safety.” This claim concerns the general population, but, “people with a rare hereditary disease known as phenylketonuria (PKU) have a difficult time metabolizing phenylalanine, a component of aspartame, and should control their intake of phenylalanine from all sources, including aspartame.” Depending on the country, PKU affects between 1 in 10,000 and 1 in 20,000 individuals, according to the National PKU Alliance.

But aspartame’s safety isn’t obvious after a quick Google search. You can easily find apparent links between aspartame and lupus, multiple sclerosis, vision problems, migraines, fatigue, or Alzheimer’s disease3. Most of these links are weak or inconclusive at best. To add insult to injury, here’s an excerpt from a 1999 Lancet correspondence from two concerned medical professionals:

Patients at our diabetes clinic have raised concerns about information on the internet about a link between the artificial sweetener aspartame and various diseases. Our research revealed over 6000 web sites that mention aspartame, with many hundreds alleging aspartame to be the cause of multiple sclerosis, lupus erythematosis, Gulf War Syndrome, chronic fatigue syndrome, brain tumours, and diabetes mellitus, among many others. Virtually all of the information offered is anecdotal, from anonymous sources and is scientifically implausible.

I think it’s safe to say the number of websites has increased since then. When I Google “aspartame health”, the search returns, “About 1,300,000 results.” Moreover, check out the Google Trend graph below for “aspartame effects” searches since 2004:

According to Google, numbers represent search interest relative to the highest point on the chart. If at most 10% of searches for the given region and time frame were for
According to Google, numbers represent search interest relative to the highest point on the chart. If at most 10% of searches for the given region and time frame were for “pizza,” we’d consider this 100. This doesn’t convey absolute search volume.

These men go onto to explain:

Aspartame, a dipeptide composed of phenylalanine and aspartic acid linked by a methyl ester bond, is not absorbed, and is completely hydrolysed in the intestine to yield the two constituent amino acids and free methanol. Opponents of aspartame suggest that the phenylalanine and methanol so released are dangerous. In particular, they assert that methanol can be converted to formaldehyde and then to formic acid, and thus cause metabolic acidosis and neurotoxicity.

Although a 330 mL can of aspartame-sweetened soft drink will yield about 20 mg methanol, an equivalent volume of fruit juice produces 40 mg methanol, and an alcoholic beverage about 60–100 mg. The yield of phenylalanine is about 100 mg for a can of diet soft drink, compared with 300 mg for an egg, 500 mg for a glass of milk, and 900 mg for a large hamburger1(my emphasis). Thus, the amount of phenylalanine or methanol ingested from consumption of aspartame is trivial, compared with other dietary sources. Clinical studies have shown no evidence of toxic effects and no increase in plasma concentrations of methanol, formic acid, or phenylalanine with daily consumption of 50 mg/kg aspartame (equivalent to 17 cans of diet soft drink daily for a 70 kg adult)1,2.

  1. in: CR Gelman, BH Rumack, AJ Hess (Eds.) DRUGDEX® System.MICROMEDEX,Englewood, Colorado; 1998 (Edition expires 1999.)
  2. ADA position statement: use of noncaloric sweeteners. Diabetes Care. 1991

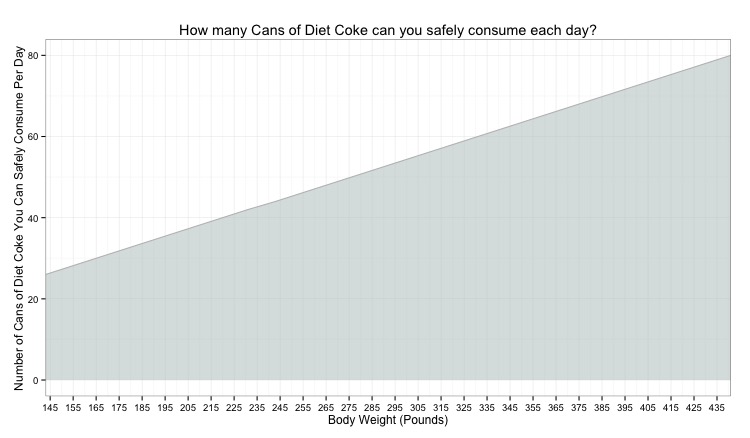
But to be clear, extremely high does of aspartame may have negative health effects. The FDA has set aspartame’s Acceptable Daily Intake (ADI) to 50 milligrams per kilogram of body weight per day, or the equivalent of a 60-kilogram (132-pound) individual consuming 75 tabletop sweetener packets or 24 cans of Diet Coke.

To make the graph, I used 35mg of aspartame in 1 packet of Equal and the 5th percentile weight of an 18 year old female in the U.S. = 65 kg (143 lb.) as a starting point. The latter represents arguably the lightest adult weight percentile in the U.S.
125 mg of aspartame in 12-0z Diet Coke
125 mg of aspartame in 12-oz Diet Coke


Don’t trust the FDA or some concerned doctors from 15+ years ago? Fair enough. In 2007, Magnuson et al. published a review of the scientific literature on, “the absorption and metabolism, the current consumption levels worldwide, the toxicology, and recent epidemiological studies on aspartame.” They came to conclusions similar to the FDA:

  • Current use levels of aspartame, even by high users in special subgroups, remains well below the U.S. Food and Drug Administration and European Food Safety Authority established acceptable daily intake levels of 50 and 40 mg/kg bw/day, respectively
  • Acute, subacute and chronic toxicity studies with aspartame, and its decomposition products, conducted in mice, rats, hamsters and dogs have consistently found no adverse effect of aspartame with doses up to at least 4000 mg/kg bw/day.
  • No credible evidence that aspartame is carcinogenic.
  • No support that aspartame in the human diet will affect nervous system function, learning or behavior.

Very recently (2015), Mallikarjuna & Sieburth conducted a meta-analysis (read: study of studies) of 10 aspartame carcinogenic bioassays on rodents (read: they measured cancer in rodents exposed to aspartame). Similar to above, they found (wait for it):

Based on the current body of scientific evidence, aggregate effect sizes revealed that APM [aspartame] consumed at any dose level has no significant relationship with cancer (occurrence of malignant tumors).

In sum, the weight of the evidence from my casual search suggests that consuming even reasonably large amounts of aspartame is safe for the general population.

That’s aspartame, but what about the other ingredients in diet soda?

Though I think it’s unlikely that aspartame consumption poses any serious saftey threats, diet soda contains other ingredients that may. For instance, many soft drinks, diet soda included, contain caramel color, which is made with ammonium compounds whose manufacture can result in the formation of 4-methylimidazole (4-MEI). 4-MEI is linked to cancer in mice and listed as a carcinogen under the Safe Drinking Water and Toxic Enforcement Act of 1986. In short, caramel color in many sodas may cause cancer. Coke changed its caramel color and Pepsi claims to be doing the same.

Ingredients aside, pop in general is acidic, so it’s probably bad for your teeth. Does that make is unsafe? If you want to claim that eroding enamel has long-term negative health effects, so then drinking diet pop in unsafe, go ahead. Then so is drinking any pop, and yet no one scoffs when someone opens a regular Coke (not because of cancer or toxicity at least).

So…?

It seems to me that diet pop is a low-risk beverage choice. I’m going to keep drinking it and rolling my eyes when people tell me I’m going to get cancer.


  1. What’s the difference between natural and artificial? There are likely few if any food stuffs in a grocery store that haven’t been adjusted by farmers or scientists or both to meet the preferences and saftey of consumers. Though we can all get a feel for what these words mean when people use them, they’re super hard to really define and I’m just not going to here.
  2. Healthy is obvious in some senses (e.g., not having Ebola) and less so in others (e.g., time it takes someone to run a mile). I think it’s easier to talk about the safety rather than the healthiness of a chemical, so I’m doing that.
  3. I used a list I found here to make my list of mythical links to aspartame

Don’t execute people, especially those with holes in their head

In 1972, Cecil Clayton, then 31, was sawing a log in a lumberyard when a wood splinter ricocheted from his blade and struck his left temple. He recovered after nine days in the hospital, but he lost about 20% of his prefrontal lobe. After his recovery, according to his brother, Cecil, “broke up with his wife, began drinking alcohol and became impatient, unable to work and more prone to violent outbursts.” Then, twenty-four years later in 1996, Clayton shot and killed sheriff deputy Christopher Casetter.

Cecil Clayton's MRI (brain scan) result revealing a substantial hole in his prefrontal lobe.
Cecil Clayton’s MRI (brain scan) result revealing a substantial hole in his prefrontal lobe.

If you’ve ever taken an introductory psychology class, Clayton’s accident and subsequent pattern of behavior might seem familiar to you. You may remember that in 1848, the young railroad company foreman Phineas Gage suffered a similar injury. He was drilling a hole in some rock and he used an iron rod to pack the hole with gunpowder, which then exploded, sending the rod through his cheekbone and out the top of his head. Gage got up from his injury still walking and talking, but, legend has it, he soon became a temperamental and violent drunk.

Computer generated depiction of where the iron rod penetrated and left Phineas Gage's skull.
Computer generated depiction of where the iron rod penetrated and left Phineas Gage’s skull.

However, people close to Gage report he still warmly entertained his nieces and became fond of animals; others report he was physically and mentally fit enough to drive a 60-mile stage couch in another country. Though, “he was no longer Gage,” following his accident, whether he became unstable and violent isn’t factual.

Clayton’s behavior, however, is better documented and has more clearly taken a turn for the worse. For example, he scored a 71 (± 4 to 5 points) on his most recent IQ test*. Moreover, since his accident,

He has the reading ability of a nine-year-old, has visual and auditory hallucinations in which he is convinced that he is accompanied by a man and a woman wherever he goes, is incapable of simple tasks such as ordering food from the prison commissary, and is under the delusion that he will never be executed because God will intervene and free him so that he can return to his preaching and gospel singing.

Ed Pilkington, The Guardian

Clayton, 74, is surely mentally disabled, yet the same year he killed Casetter, he was sentenced to death in Missouri. Recently, on Saturday, March 14th, he was denied a mental competency hearing, the only chance for him to establish his disability and save his life. Yet even if his lawyers were succesful in attaining such a hearing, it may not nullify his death sentence. Though the Supreme Court has repeatedly ruled that the 8th amendment excludes the execution of the “intellectualy disabled”, each state is allowed to use its own definition of intellectually disabled. Clayton’s fate may very well boil down to Missouri’s statute that requires intellectual disability be established by the time the inmate turns 18. That is, it wouldn’t matter if Clayton had lost half his brain and most mental capacities imaginable by age 19; his tragic mental state would be irrelevant to his execution ruling. So, barring intervention by the U.S. Supreme Court or the governor of Missouri, Clayton will die today by lethal injection.

Cecil Clayton is reasonably a dangerous man. However, given the state of his mind, it’s cruel to execute him. One psychologist noted Clayton, “is not simply incompetent legally, he would be unable to care for himself or manage basic self-care, were he not in a structured environment that takes care of him … he still does not comprehend, appreciate nor understand its approaching date for him.” What purpose would be served by killing this person?

Maybe retribution? I might suffer from a lack of imagination, but I can’t fathom retributive justice—essentially state condoned vengenece—as ever being good reason for any punishment, let alone execution. Perhaps, though, executing Clayton will serve some sort of deterrent purpose? This I think is even more ridiculous than retributive justice: executing Clayton to set an example for the rest of the mentally disabled also contemplating murder. In other words, the hope would be that other mentally disabled men and women would, upon learning the news of Clayton and others’ fates, consider the serious legal consequences of murder.

No.

So whether it’s to exact vengeance or deter future mentally handicapped murderers, I have difficulty not guffawing at the thought of any reason to execute Clayton or anyone like him. Moreover, the absurdity of furnishing any good reason to execute a man with a hole in his brain should call into question the very idea of executing anyone. Indeed, former Supreme Court Justice Harry Blackmun, who in 1976 voted to reinstate the death penalty in Gregg v. Georgia, famously renounced his position on the death penalty, stating, “From this day forward, I no longer shall tinker with the machinery of death.” Yet, on we tinker.

Sources not in text:

*Full Scale scores beyond 130 place an individual in the superior or “gifted” range. Scores between 120-129 are classed as “very high.” Scores between 110-119 are “bright normal.” Classifications of other scores are as follows: 90-109, average; 85-89, low average; 70-84, borderline mental functioning, 50-69, mild mental retardation; 35-49, moderate retardation; 20-34, severe retardation; below 20 to 25, profound retardation (The Wechsler Intelligence Scales). However, Hall v. Flordia ruled it unconstitutional to set an IQ requirement for determining intellectual disability.

…they want to see what you have made with your own little fingies

You have to make stuff. The tools of journalism are in your hands and no one is going to give a damn about what is on your resume, they want to see what you have made with your own little fingies. Can you use Final Cut Pro? Have you created an Instagram that is about something besides a picture of your cat every time she rolls over? Is HTML 5 a foreign language to you? Is your social media presence dominated by a picture of your beer bong, or is it an RSS of interesting stuff that you add insight to? People who are doing hires will have great visibility into what you can actually do, what you care about and how you can express on any number of platforms.

David Carr, http://bit.ly/1zd17vs

Tips at a coffee shop

Since I’ve graduated, I’ve worked at coffeeshops part-time. I’ve worked at this one for about two years now. I keep track of my tips.

Tips per Hour by Shift

Figure 1. Tips per hour (95% CI) by shift: Open (5:30-10:00 AM), Mid (10:00-4:00 PM), Close (4:00-10:30 PM). Open/Mid and Mid/Close are double shifts.

If you’re interested in about how big some of those differences are:

Effect Sizes for Tips by Shift Comp

What is Hedge’s g?

It’s a computation of the difference in some measure (Tips per Hour in this case) between conditions (Shift in this case) in terms of standard deviation (basically, average deviation from the mean). Basically, a Hedge’s g of 1 is equal to a difference in Tips per Hour by 1 whole standard deviation. In social science research, 0.7 (large effect) means, roughly, “You can fucking see the difference out in the world without a t-test.” Since differences in tips between the closing shift and both the opening and midday shifts are well above a g of 1, you’d expect to see clear differences (over $1.70, the standard deviation) in the tip jars between these shifts.

Sinning in the Aisles or at the Register

20131123-132812.jpg

Some time ago I posted on the (Not Quite) Science of Vice Taxes. I argued that social science can inform policy, but the science part of that term is important; if you think a policy is going to have an effect on behavior, then test it first.

If you don’t have time or money to collect the data, run with the status quo. The traditional view in economics is that price matters for consumers, end of story. Economically rational people will pick up a candy bar for $1 but take it back when the receipt says $1.07. Homo economicus doesn’t pay $1.07 for candy bars whether the price is on the sticker or on the receipt.

In a recent interview on NPR, Princeton economist Jacob Goldin explained that this is not the case. The posted price matters because it’s obvious–one study found that demand for groceries went down 8% when tax was included in the sticker price. Even smart people don’t generally calculate their future taxes at the register while they’re throwing items in their shopping cart.

The bottom line for policymakers is clear: If you want people to consume less of something, make the tax more obvious. If you want to just collect more money, make it less obvious.

Consistent with the idea in my earlier post, it appears that policy makers in Conneticut, New York and New Jersey did not have research in mind when they placed sales taxes, not production taxes, on candy and soda-pop.

Colorado doesn’t do much better. In the hopes of funding schools and marijuana trade regulation, Colorado’s strategy should be to collect from a subtler tax. In reality, they employ a mixed strategy: a 15% tax on production and a 10% tax on sales. In theory, people will actually buy less pot in reaction to the higher sticker price. This may be unwise: If you’re running a business fueled by the fires of the sinful, maybe you shouldn’t douse your flames.

Graphing the difference between NHST and ESCI

I’ve been some kind of research assistant for a few years now, so I’ve learned a trick or two about making graphs in Excel. However, I’ve had a lot of trouble trying to figure out how to graph two independent sample means and their differences each with 95% confidence intervals. In the spirit of my last few blogs on the shift from using means and p-values (i.e., NHST) to using point estimates, confidence intervals and effect sizes (ESCI), I want to try to use the same data to make a graph from each approach.

I’ll use data from, “an experiment to test whether directed reading activities in the classroom help elementary school students improve aspects of their reading ability. A treatment class of 21 third-grade students participated in these activities for eight weeks, and a control class of 23 third-graders followed the same curriculum without the activities. After the eight-week period, students in both classes took a Degree of Reading Power (DRP) test which measures the aspects of reading ability that the treatment is designed to improve.” I obtained these data from the Data and Story Library. I expect the treatment group to score higher on the DRP than the control group.

NHST:

Results of a one-tailed, independent samples t-test with Welch correction for unequal variances reveal that students in the treatment group (M=51.5, SD=11.0) scored significantly higher, t(37)=2.01, p<0.01, on the Degree of Reading Power test than students in the control group (M=41.5, SD=17.1).

DRP_esci


Figure 1. Mean scores on Degree of Reading Power (DRP) by group. Error bars represent 68% confidence intervals by convention because it looks nicer.

ESCI:

I found a 9.95 [1.1, 18.8] point difference, d=0.7, between the scores of those students in the treatment group, 51.5 [46.5, 56.5] and those in the control group, 41.5 [34.1, 48.9].

DRP_nhst


Figure 2. Means of scores by group and the mean difference between groups on Degree of Reading Power (DRP). Error bars represent 95% confidence intervals so you can actually interpret the accuracy of the means.

So there you have it. This is what could be for the future of psychological science, or close to it. I don’t know about you, but I think that the second report of the results tells me more about what matters in the experiment–how effective is the treatment condition for improving reading power? It appears we can safely conclude that the treatment improves reading power compared to a control group, but the estimate of how much improvement isn’t very accurate. There’s a 20 point spread that includes 1.

In regards to my technical issues, I couldn’t figure out how to place the mean difference data point on the right of the graph next to the secondary axis. If anyone has any suggestions as to how this might be done in Excel, please write in the comments. Thank you.

The (not quite) Science of Vice Taxes

Image

Although it’s a fleeting desire, people do actually want to be healthy. When they’re motivated to maintain or improve their health, people will seek out information to do so and act accordingly. Unfortunately, the mind is a divided system of competing motivations, and “be healthy” is not one motivation to pick fights. This idea, that health is a losing motivation for many people, can explain why obesity is such a problem in a country with cheap, calorie-dense foods. The widely accepted proposal to address this is to trigger another seemingly more powerful motivator: money. The prevailing logic is that people will buy less unhealthy products if those products are more expensive. If we tax alcohol, tobacco, and sugar, people will buy less of these products and, hopefully, drink less, smoke less, and consume fewer calories.

When Mayor Bloomberg of New York City proposed taxes on large sugary drinks, it was exciting because it seemed like policy makers might finally be taking the advice of psychologists and behavioral economists. It’s common to think that medicine and engineering provide drugs, treatments, structures and technologies that realistically impact our lives, but that behavioral sciences aimlessly document how people think and behave in counter-intuitive ways. A beautifully engineered iPhone 5 might drive computing and communication into a new age, while a study priming men to be measurably more creative seems nothing more than an interesting read over coffee at the kitchen table. In fact, behavioral science research supplies necessary tools for addressing human problems (see Scott Atran’s argument here).

Despite the potential to inform public policy, behavioral science, like natural science, requires empirical evidence. Hunches gleaned from quasi-related research won’t cut it, and neither will lab experiments alone. Just like approving the safety of a plane requires more than good computer simulations, or a safe drug requires more than thorough animal trials, real confidence in policy aimed at changing public behavior requires randomized experiments, field studies, and large-scale observational research (see Dave Nussbaum’s piece here, and Richard Thaler here). I think that the proposal to tax soft drinks falls short of actual applied behavioral science. Though there is good theory to expect vice taxes to reliably decrease the behaviors at which they’re targeted, the empirical data just aren’t there (or the effects are small, see Fletcher, Frisvold, & Tefft, 2010).

A good example of randomized trials that could inform policy comes from research at Cornell. Brian Wansink and colleagues published their findings from a field study in the eastern United States. Over 6 months, they tracked the purchases of over 100 households, half of which received a 10% tax on low nutrient: calorie foods during the treatment period. They found that although the treatment group (compared to control) purchased significantly less taxed, unhealthy foods during the first month, these differences disappeared by three months, and purchases were unchanged by six months. Moreover, among those in the treatment group, households that reported to be regular beer and fruit juice purchasers actually increased their purchases of these products.

It is findings like these that, if communicated effectively, would shock a committee assembled to discuss vice taxes. The point is not to suggest that we avoid policy designed to nudge people into make better decisions. Rather, we should inform our decisions about such behavioral change, and who better to inform us than the experts on behavior themselves—economists, psychologists, sociologists and the like. Alas, my fear is that paying for social experiments to inform policy is not a high priority, much like “be healthy” is not a strong motivation.

References

Fletcher, J. M., Frisvold, D., & Tefft, N. (2010). Can soft drink taxes reduce population weight?. Contemporary Economic Policy28(1), 23-35.

Wansink, B., Hanks, A., Just, D., Cawley, J., Sobal, J., Wethington, E., & Schulze, W. (2012). From Coke to Coors: a field study of a sugar-sweetened beverage tax and its unintended consequences. Available at SSRN.